
Bikes and Environmental Justice
- Kevin Shin
- Jul 13, 2011
- 2 min read
Why low-income communities?
While the tireless efforts of the local bicycle movement has made massive strides in winning safer streets, less attention has been focused on the needs of the large numbers of marginalized, low-income people of color who bicycle. LACBC believes that in order to create a more inclusive community, engaging, organizing, and advocating for these communities’ needs are key; our work in low-income areas has included projects in neighborhoods such as MacArthur Park, Downtown LA, and Boyle Heights in the City of Los Angeles, unincorporated Los Angeles County, such as East LA and Firestone/Florence, Compton, and Long Beach.
There are many high-density urban areas in Los Angeles County with large numbers of transit -dependent residents and high rates of walking and bicycle usage, yet they tend to contain much fewer, if any, bicycle facilities. Not surprisingly, data extrapolated from the TIMS database created by SafeTrec at UC Berkeley shows disproportionately higher concentrations of pedestrian and bicycle crashes in low-income areas than in more affluent areas.
Yet transportation planners and policy-makers have generally failed to address many of the problems of dangerous streets where the highest need lies.
This presents a major environmental and social injustice. Through the installation of more facilities in these neighborhoods, the City of Los Angeles will not only reduce deaths and injuries to low-income people who bicycle, but reduce the overall number of bicycle-related fatalities and injuries citywide. In addition to LACBC’s campaign work in these communities, we also recognize the need for more documentation and data showing conditions in these neighborhoods. While hard data on ethnicity/class breakdown of people who bicycle is virtually non-existent (the Census’ American Community Survey does not break down non-motorized modes by race), there are large numbers of low-income cyclists. The first ever City of Los Angeles Bike Count conducted by LACBC in 2009 demonstrated that large numbers of cyclists were observed at intersections in low-income neighborhoods with no bicycle infrastructure, comparable in some cases to intersections in more affluent neighborhoods that had some sort of bicycle infrastructure. To illustrate this need and help create an accessible resource for other community groups and scholars, LACBC has created a series of downloadable maps that show how crash fatalities are unevenly distributed in areas of higher density and lower-income neighborhoods in the City of Los Angeles.
How to Interpret These Maps
Map A illustrates all of the locations where a crash resulted in the death of people walking or biking from 2000-2008 in the City of Los Angeles and population density by acre. Each red dot represents one crash. The blue areas represent areas of low population density, as it graduates to red population density increases. This illustration shows that a vast majority of the crashes are concentrated in areas of higher population density.
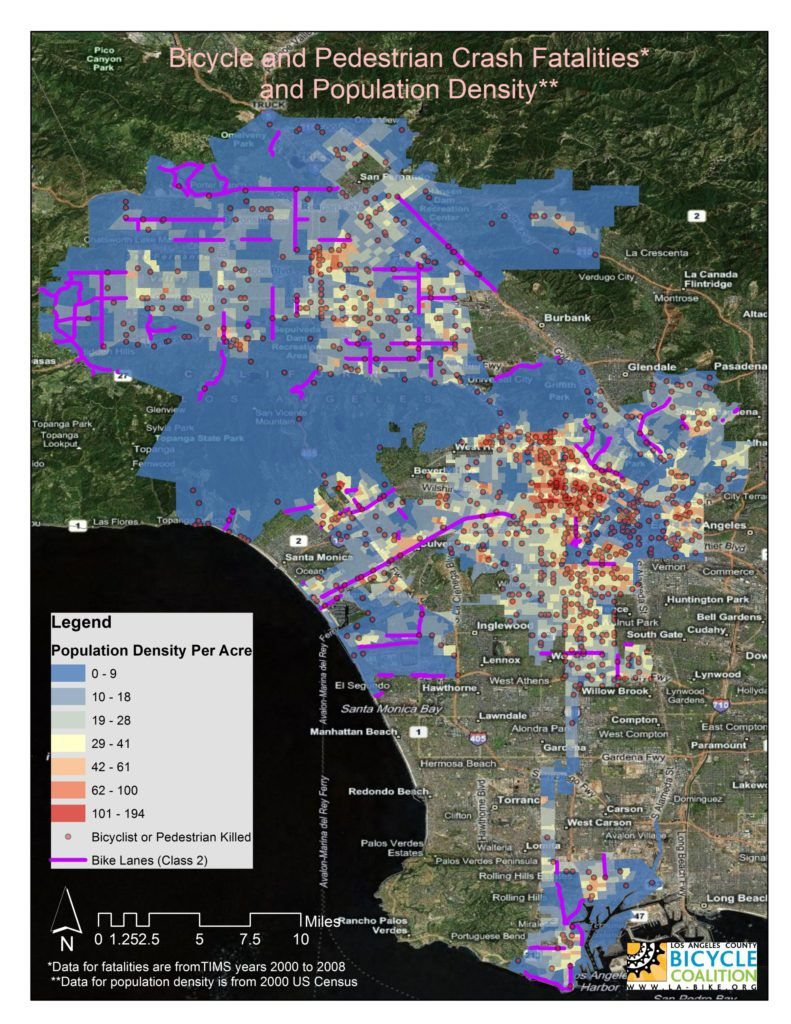
Bicycle and Pedestrian Fatalities and Population Density
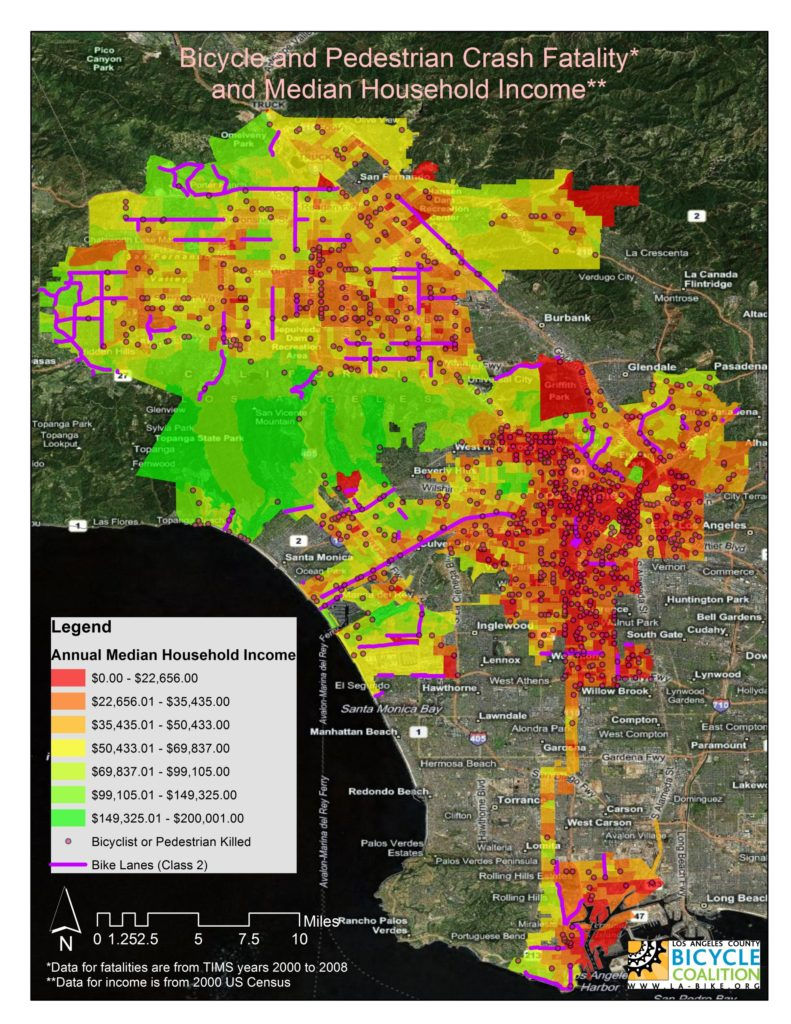
Map B illustrates the crash fatality locations and the median household income of these locations. On this map the areas of high income are represented by green. The income is lower as it becomes red, which represents a median household income of $22,650.00 or less. This illustration displays a large concentration of crash fatalities occurring in the urban core of Los Angeles where the median household income is the lowest.


Comments